
Gravimetry
Gravimetry and Gravity gradiometry is a field of science which supposedly measures the strength of the earth's gravitational field. In these discussions Gravimetry is often used as evidence that the gravitational field of the earth varies with latitude and by location.
It has been found that Gravimetry is not directly measuring gravity at all. The Gravimeter devices have been described by professionals in that field as long-period seismometers that are measuring small "jerks" in the background seismic noise and interpreting it as variations in gravity.[1] The theory behind gravimetry is that it is detecting tiny density variations in the noise which are called "gravity waves" and "infragravity waves"[2] Gravimeters are, in truth, seismometers. Seismometer devices have been described as having a "gravimeter mode."[3] Seismometers can double-purpose as gravimeters, and can detect the "gravity tides". Gravimeters are often similarly double-purposed as seismometers to detect earthquakes thousands of miles away.[4]
Perhaps most illustrative, gravitational anomalies on gravity maps are indistinguishable from the seismic zones.[5] There are also several items which do not make sense with the gravity anomalies if they were actually a measurement of mass. Mountains and continents are seen to dampen gravity readings rather than to increase them. [6]
Further, the differences by latitude and altitude in the gravimetric end product data are seen to be artificial corrections that are added or subtracted to the data and reference model, rather than information that is from the measurements. Operators are told to make a correction for latitude, essentially inputting the variations. Even absolute gravimeters determine local gravity from an equation which uses the gravitational accelerations of the equator and poles with the device latitude.[7]
The theory behind the field of Gravimetry is that the masses in the subsurface are creating tiny variations or jerks, presumed to be due to "gravity", that are measured by the devices in a unit of measurement called uGal or mGal. We read a description of Gravity Gradiometry on Wikipedia:
https://en.wikipedia.org/wiki/Gravity_gradiometry (Archive)
“ Gravity gradiometry is the study and measurement of variations in the acceleration due to gravity. The gravity gradient is the spatial rate of change of gravitational acceleration.
Gravity gradiometry is used by oil and mineral prospectors to measure the density of the subsurface, effectively by measuring the rate of change of gravitational acceleration (or jerk) due to underlying rock properties. From this information it is possible to build a picture of subsurface anomalies which can then be used to more accurately target oil, gas and mineral deposits. It is also used to image water column density, when locating submerged objects, or determining water depth (bathymetry). Physical scientists use gravimeters to determine the exact size and shape of the earth and they contribute to the gravity compensations applied to inertial navigation systems. ”
What is Gravimetry?
A quote from the Enhanced Geothermal Innovative Network for Europe (Archive) explains:
“ Gravimetry
As the gravitational field of the earth depends on the density of the rocks, variations of the gravitational field (Bouguer anomalies) observed at the surface or in a borehole are due to density changes in the subsurface, which can be interpreted in terms of changes in the composition and/or geometry of the geological layers. ”
From Gravity surveying: a brief introduction (Archive) we read:
“ Everything is gravitationally attracted to everything else. And the gravitational attraction of an object is proportional to its mass. So if the rocks below you at a given place are denser, then the gravity there will be slightly larger. The changes in gravity from place to place are small: gravity, g, at the Earth’s surface is about 9.81ms−2, but the local variations are a tiny fraction of this; often we are measuring differences of 10−6 ms−2. ”
In The Gravity Method (Archive), its author Dr. Nicolas O. Mariita tells us:
“ The success of the gravity method depends on the different earth materials having different bulk densities (mass) that produce variations in the measured gravitational field. These variations can then be interpreted by a variety of analytical and computers methods to determine the depth, geometry and density that causes the gravity field variations. ”
The Global CCS Institute (Archive) says:
“ Gravimetry consists of studying the anomalies of the gravity field due to density variations underground. ”
A New Mexico Tech Exploration Geophysics II course says (Archive):
“ Gravimeters do not measure the absolute value of gravity, but rather relative changes in gravity. The dial reading for each measurement needs to be multiplied by the instrumental dial constant to provide the relative gravity in mGals. In order to interprete the gravity measurements in terms of the geology of the survey area, various corrections need to be applied to the data. These include correcting for instrumental drift, tides and elevation (which includes the free-air correction and Bouguer correction). The gravity anomaly is determined by taking the difference between the observed measurements and the theoretically calculated value (GRS67) for that location. Once the corrections have been applied and the gravity anomaly determined, the data can now be interpreted in terms of subsurface properties. ”
Seismometers are Gravimeters
Comparative Study
Comparative study of superconducting gravimeters and broadband seismometers STS-1/Z in seismic and subseismic frequency bands (Archive)
“ Superconducting gravimeters and broadband seismometers (vertical component) both measure gravity, but whereas the former are most sensitive to very long period signals (gravity tides with periods longer than 6h), the latter are designed for recording the seismic band (elastic normal modes with periods shorter than 1h) ”
Diagram from p. 212:

The paper says that when comparing Gravimeters to the Seismometers, the gravity spectra is nearly identical:
“ The gravity spectra of the BFO station show that the seismometer STS-1/Z and the superconducting gravimeter are almost equivalent (see also Ritcher et al. (1995)). Therefore we believe that the high noise level shown by the superconducting gravimeter in Strasbourg is probably due to site effects rather than to the instrument itself: a possible reason is that Station J9 is located on a thick layer of sediments (about 3000m) in the Rhine Graben which amplifies noise at long periods. ”
Tidal Detection
Further, the above paper states that seismometers are also able to detect the tides -- p.204, second paragraph:
“ A first attempt to use broadband seismometers outside their traditional spectral range was made by Pillet et al. (1994), and they showed that the STS-1 is able to receive strong tidal signals around diurnal frequencies. ”
The STS-1 is a seismometer (see caption text in last diagram).
It is mentioned that the "gravity tides" are found in the subseismic band:
“ Two different frequency bands are considered: the seismic band (frequencies between 0.2. and 1.667 mHz), for the study of normal modes after the Bolivian earthquake of 9 June 1994, and the subseismic band (frequencies lower than 0.2 mHz), including the study of gravity tides. ”
A definition of "subseismic band" (Archive):
“ "subseismic band" (i.e. frequency lower than 0.03mHz) that has very strong background noise; ”
Is a study of subseismic activity a study of gravity?
Gravimeter Mode
From https://en.wikipedia.org/wiki/Gravimeter (Archive) we read:
“ Many broadband, three axis, seismometers in common use are sensitive enough to track the sun and moon. When operated to report acceleration, they are useful gravimeters. Because they have three axes, it is possible to solve for their position and orientation, by either tracking the arrival time and pattern of seismic waves from earthquakes, or by referencing them to the sun and moon tidal gravity.
Recently, the SGs, and broadband three axis seismometers operated in gravimeter mode, have begun to detect and characterize the small gravity signals from earthquakes. ”
The reader might ask, if gravimeters are entirely different devices than seismometers, how could seismometers have a "gravimeter mode"?
Gravimeters are Seismometers
This inventor describes gravimeters as follows:
http://www.njsas.org/projects/tidal_forces/magnetic_gravimeter/baker/ (Archive)
“ A seismometer usually looks for the smallest possible acceleration changes. Since gravity is physically the same as acceleration, gravimeters are merely versions of seismometers with an infinitely long period response. ”
From p.2 of a paper on seafloor measurements (Archive) from the Journal of Geophysical Research we see:
“ We have collected vertical compliance data using a gravimeter (long-period seismometer) and a differential pressure gauge ”
On p.4 of The Gravity Method (Archive) by Dr. Nicolas O. Mariita we read another reference:
“ An important factor in obtaining useful gravity values in detailed surveys is determining the earth tide effect as their gravitational effects may be greater than the gravity field variations due to the anomalous features being sought. The final aspect of reading a gravity meter concerns seismic activity or cultural movement such as those of vehicles or people. These will disrupt the readings (the meter is actually a low-frequency seismometer) and even though the Scintrex meter has an anti-seismic filter (the La Coste-Romberg meters are also mechanically damped to lessen the effects of earthquakes), readings will still be disrupted. ”
Again, we see that the gravimeter is actually a seismometer, and will be easily disrupted by seismic activity and other noise.
Recall from the above seismometer section that the seismometer was detecting gravity tides on subseismic bands, which was described as:
“ 'subseismic band' (i.e. frequency lower than 0.03mHz) that has very strong background noise ”
This agrees with the 'low-frequency' statement given by Dr. Marrita above. The gravimeter is a low-frequency seismometer, taking data out of those low-frequency bands.
On p.14 from a University of Hawaii lecture (Archive) we read:
“ GRAVITY METERS (GRAVIMETERS).
Nearly all gravity surveys use gravimeters to take their data. A gravimeter is identical to a long-period seismometer in most respects, the only difference being that the goal is to measure the force needed to center the mass, which is proportional to g. ”
Function of a Gravimeter
It is often argued that a gravimeter works by dropping a body and measuring the full acceleration. While some types of gravimeters drop bodies, others do not. Consider how the following gravimeter works:
https://schmidtocean.org/rv-falkor/operations-and-science-systems/gravimeter/ (Archive)
“ The gravimeter, about the size of a steamer trunk, uses magnetism to suspend an internal metal cylinder, and measures changes in the way gravity pulls on that cylinder. Many people are familiar with the fact that acceleration from gravity—for instance if you jump out of a plane—is 9.8 meters per second squared. Measured in milligals (mGals)—a common research unit for gravity—that’s 980,000. Remarkably, the gravimeter can detect changes as small as 1 mGal—or roughly one millionth of gravity’s total pull. ”
The above device does not contain a falling object. The magnetism suspends the cylinder. The system then measures changes to that cylinder. The article continues:
“ The researchers aren’t interested in that total pull, though; they’re interested in learning about the seafloor. So they process the data coming in to subtract out all the normal weight of Earth below them, which is relatively constant, as well as the weight due to topography, which they get from the sonar mapping. ”
As directly stated, the interest isn't in the total pull. The designers mainly care about using the device as a seismometer.
Absolute Gravimeter Description
From Geophysics From Terrestrial Time‐Variable Gravity Measurements we read about a device that does involve a falling object. The interest is in the tiny noises that affect the mirror in the device while the body is in free fall and disconnected from the Earth:
“ In an absolute gravimeter, a test laser beam bounces off the free‐falling body before being reflected back to the interferometer, where the test beam interferes with a reference one. While the dropped mass is completely isolated from the Earth's vibrations during its fall, anthropogenic and natural microseismic noises continuously modify the position of the reference mirror of the interferometer. Even in the absence of an earthquake, the displacements of the Earth's surface are persistent and location and season dependent, reaching up to a few micrometers close to the coast (Kedar et al., 2008), while one should measure the free‐fall distance at the 1 nm precision level in order to achieve a precision on gravity of 10 nm/s^2. In the first white‐light gravimeter, the measurements of gravity were corrected by using the records from a 1 s period seismometer. Early in the 1980s, Rinker (1983) developed the so‐called Super Spring, that is, a modified seismometer providing an inertial reference system at periods shorter than about 1 min—the suspended mass of a seismometer provides an inertial reference frame, independent from the motions of the Earth, at periods shorter than the resonance frequency (Aki & Richards, 2002). The challenge consisted in producing a suspension device of which the free period is about 1 min, that is, longer than the periods ranging 5–20 s, where microseism is the strongest. ”
Monitoring earthquakes with gravity meters
From the abstract of a paper titled Monitoring earthquakes with gravity meters (Archive) we read:
“ Seismic waves from a magnitude 8.3 earthquake in Japan were consistently recorded by five nearly identical gPhone gravity meters in Colorado. Good correlation was also found in the response of two different types of gravity meters and a standard seismometer in Walferdange, Luxembourg to an earthquake of magnitude 8.2 in Japan, indicating that all of them were capable of measuring the surface waves reliably. The gravity meters, however, recorded 11 separate arrivals of Raleigh waves, while the seismometer only one. Thus the gravity meters may be useful for obtaining new information in the study of seismic velocities, attenuation and dispersion. ”
The ending two sentences of that abstract even imply that gravity meters may be superior for measuring seismic elements.
Earthquake Comparison Readings
From the study we see several seismic reading comparisons between gravimeters (gPhone) and seismometers (STS-2):


Gravity anomalies observed before earthquakes
Pre-seismic gravity anomalies before Linkou Ms 6.4 earthquake by continuous gravity observation of Crustal Movement Observation Network of China (Archive)
The reader may ponder why the gravity of the earth would change before an earthquake.
Onsala Space Observatory / Gravity Laboratory
Look at these gravimeter readings from the Onsala Space Observatory's Superconducting Gravimeter (Archive) and decide if the readings looks like the output of a seismometer with values above and below zero. Determine which values are the raw readings before a noise reducing filter is applied.
http://holt.oso.chalmers.se/hgs/SCG/daily-residual-plots.html (Archive)
24 hours of gravity residual, 1-s sampling

“ The gravity residual is computed by subtracting an empirical tide model and subtracting the local air pressure with an empirical coefficient. A linear drift term has also been subtracted. Offsets from zero arise most often due to pressure anomalies that are either greater or smaller than average in their regional extent." ”
Gravity Wave Theory
A study titled Seafloor Compliance Observed by Long-Period Pressure and Displacement Measurement (Archive) uses gravimeters to study the gravity of the ocean. On p.2, para.4 its authors call the gravimeter a long-period seismometer.
“ We have collected vertical compliance data using a gravimeter (long-period seismometer) and a differential pressure gauge ”
On the same page we read about the theory behind the measurements:

We see that the theory behind the measurements involve the theories of "Gravity Waves" and "Infragravity Waves". Wikipedia describes them as:
https://en.wikipedia.org/wiki/Gravity_wave (Archive)
“ In fluid dynamics, gravity waves are waves generated in a fluid medium or at the interface between two media when the force of gravity or buoyancy tries to restore equilibrium. An example of such an interface is that between the atmosphere and the ocean, which gives rise to wind waves.
A gravity wave results when fluid is displaced from a position of equilibrium. The restoration of the fluid to equilibrium will produce a movement of the fluid back and forth, called a wave orbit.[1] Gravity waves on an air–sea interface of the ocean are called surface gravity waves or surface waves, while gravity waves that are within the body of the water (such as between parts of different densities) are called internal waves. Wind-generated waves on the water surface are examples of gravity waves, as are tsunamis and ocean tides. ”
https://en.wikipedia.org/wiki/Infragravity_wave (Archive)
“ Infragravity waves are surface gravity waves with frequencies lower than the wind waves – consisting of both wind sea and swell – thus corresponding with the part of the wave spectrum lower than the frequencies directly generated by forcing through the wind.
Infragravity waves are ocean surface gravity waves generated by ocean waves of shorter periods. The amplitude of infragravity waves is most relevant in shallow water, in particular along coastlines hit by high amplitude and long period wind waves and ocean swells. Wind waves and ocean swells are shorter, with typical dominant periods of 1 to 25 s. In contrast, the dominant period of infragravity waves is typically 80 to 300 s,[1] which is close to the typical periods of tsunamis, with which they share similar propagation properties including very fast celerities in deep water. This distinguishes infragravity waves from normal oceanic gravity waves, which are created by wind acting on the surface of the sea, and are slower than the generating wind. ”
Essentially, the "Gravity Waves" are slight motions and vibrations picked up by the gravimeter (seismometer). A chart is provided, showing the frequencies that the winds and tides appear in:

In line with the previous seismometer section, the tides appear on the low frequency bands.
Corrections for Latitude
It is asserted that gravimetry has shown trends at different latitudes, and so this is validation of the idea that it is really measuring "gravity". We find that this assertion is unfounded.
From a university course on gravity surveying we read:
http://www.geol-amu.org/notes/m10-1-4.htm (Archive)
“ Recall that, if the Earth were an homogeneous ellipsoid, the value of gravity at the surface would be given by:
g = g0 (1 + k1 sin2 ϕ – k2 sin2 2ϕ)
The objective of gravity surveys is to look for deviations from this reference value. ”
If the objective of gravity surveys is merely to look for deviations from a round earth reference model with the vibrating gravity theory, then the final computed number in meters per second squared would becomes meaningless for the purpose of discussion. Any modifications to the reference values are constructed on an entirely theoretical basis.
The above page tells us that there is a theoretical model and that the goal of gravity surveys is to modify that model. Further down we see, among the list of corrections to be made, the latitude correction:
“ Latitude correction: The earth's poles are closer to the centre of the equator than is the equator. However, there is more mass under the equator and there is an opposing centrifugal acceleration at the equator. The net effect is that gravity is greater at the poles than the equator.
For values relative to a base station, gravity increases as you move north, so subtract 0.811 sin(2a) mGal/km as you move north from the base station. (where a is latitude). ”
We read that we are subtracting or adding values to the reference model and the data to make the corrections for latitude, which is very different than using the data to determine the latitude. The claim that the final number is meaningful as evidence to showcase any particular point may be fallacious.
Note: The reference 'for values relative to a base station' may imply that this is referring to a relative gravimeter.
United Nations University
On p.9 of Seismic Activity, Gravity, and Magnetic Measurements (Archive) by LaGeo as part of the United Nations University Geothermal Training Program we read:
“ 3.6 Reduction of data
Gravimeters do not give direct measurements of gravity; rather, a meter reading is taken which is then multiplied by an instrumental calibration factor to produce a value of observed gravity (known as gobs). The correction process is known as gravity data reduction or reduction to the geoid. The various corrections that can be applied are the following. ”
The section goes on to list a number of corrections, including corrections for latitude and elevation, which is not data contained in the measurement readings:
“ Latitude correction (gn) - Correction subtracted from gobs that accounts for earth's elliptical shape and rotation. The gravity value that would be observed if the earth were a perfect (no geologic or topographic complexities) rotating ellipsoid is referred to as the normal gravity.
gn = 978031.85 * (1.0 + 0.005278895 sin 2 (lat) + 0.000023462 sin4(lat)) (mGal) (4)
where lat is latitude ”
“ Free-air corrected gravity (gfa) - The free-air correction accounts for gravity variations caused by elevation differences in the observation locations ”
These are artificial corrections which are added or subtracted to the data and reference model. If the earth were really elliptical or rotating, and if the devices were really measuring gravity in full, then these artificial corrections would not be necessary. It is seen that the devices are seismometers and that these corrections are artificially added into the data as modifications.
Absolute Gravimeter Corrections
A common response to some of the references above is to declare that even thought he sources do not specify, the sources must solely be talking about relative gravimeters, and that absolute gravimeters are completely different devices which measures gravity in full. Yet, despite this argument we see that even absolute gravimeters determine local gravity through a model involving the gravitational acceleration of the equator and poles.
Terrain-aided navigation with an atomic gravimeter (Archive)
Introduction
"The purpose of the paper is to provide a solution for surface or sub-surface navigation by Terrain Matching using an absolute gravimeter."
On the third page:
III. A METHOD TO MAP THE GRAVITY ANOMALY WITH THE ATOMIC GRAVIMETER

Elsewhere it describes that "Φ is the longitude and λ the latitude. g(Φ, λ) is the modulus of the local gravity acceleration vector"
To determine the local gravity acceleration the device invokes a model involving an equation using gravitational acceleration at the equator and poles with the latitude, and the results are then added to the gravity anomaly (Last line: g(Φ, λ) [Local gravity] = g0(λ)[standard gravity accounting for latitude gravity gradient] + ga(Φ, λ) [gravity anomaly]) We see similar equations (sin 2 lat) as in the previous latitude corrections. Why should this be necessary to involve the gravitational accelerations of the equator and poles to determine the local gravity? If an absolute gravimeter is measuring gravity in full then it should measure gravity in full.
Mobile Atom Interferometer
Similarly, we read the following about latitude corrections for a precision free-fall device:
Gravity surveys using a mobile atom interferometer (Archive)
Introduction
“ atomic gravimeters rely on matter-wave interferometry with a freely falling atomic cloud ”
~
Latitude and terrain correction
“ We correct the gravity values collected in the Berkeley Hills for latitude variations using the WGS84 ellipsoidal gravity formula (38) to create latitude-corrected gravity anomalies. ”
~
References and notes
“ 38. Department of Defense World Geodetic System 1984: Its definition and relationships with local geodetic systems (NIMA Technical Report 8350.2, 3rd ed., National Imagery and Mapping Agency, Washington, DC, USA, 1997). ”
We again see a precision free-fall gravimeter which is corrected for latitude.
WGS84 Ellipsoidal Gravity Formula
On p.13 of a paper titled Invited Review Article: Measurements of the Newtonian constant of gravitation, G (Archive) we see a summary of the WGS84 ellipsoidal gravity formula:
“ The local acceleration is a sum of the centrifugal acceleration and the gravitational acceleration. At the equator, the local acceleration is reduced by the centrifugal acceleration. This effect is exacerbated by the fact that the figure of the Earth is in response to the centrifugal acceleration an oblate spheroid. Hence the polar radius is smaller than the equatorial radius, increasing the gravitational part of the local acceleration towards the pole. A model describing this normal gravity g0 approximately, the so-called reference ellipsoid, is WGS8497,

and Φ denotes the latitude. This formula describes the theoretical local acceleration on an equipotential surface at mean sea level. It includes both gravitational and centrifugal potentials. ”
This is a very similar equation to the absolute gravimeter local gravity equation given in a section previous to this [8](sin 2 lat).
The text around this p.13 quote also strongly indicates that the WGS84 equation for the gravity variations was determined based on the weight change experiments conducted at different latitudes and which affects pendulums and scales. From the sentence immediately prior to the above quote:
“ [In] 1672, Jean Richer noticed on a trip to French Guiana that the oscillation frequency of a seconds pendulum depends on the geographical latitude ”
We hence see that the gravimeters, including absolute gravimeters, are adjusting the output for local gravity based on a latitudinal formula that was determined by a different experiment (Note: This is a determination which may be flawed in interpretation; see Weight Variation by Latitude). Once again, if the absolute gravimeter is measuring gravity in full, why should equations involving gravity's latitudinal differences of the equator and poles be necessary to determine local gravity?
Seismic Map Similarities
Convergent Plate and Earthquake Map
Compare the gravity anomalies (first image) to a map of the plate boundaries and the earthquake zones (second image):


World Volcano Map
Compare the gravity anomalies (first image) to a world volcano map (second image):

- World Volcano Map Source p.10 (Archive)
Seismic Hazard Maps
Compare the gravity anomalies to seismic hazard maps of various locations.
South America


Alaska


Middle East


Earthquake Map
Compare the gravity anomalies to a map of earthquakes with magnitudes of 6.5 and above.

Perplexing Anomalies
The anomalous deviations of gravity, as detected by the gravimeter, are called Bouguer Anomalies.
Gravity Anomalies Contrary To Theory
Bouguer Anomalies Over The Continents and Oceans (Archive) in the Journal of the Geological Society of India tells us that the anomalies are greater over the ocean than over the land, which is contrary to gravity theory:
“ Why, in general, the Bouguer gravity anomalies are negative in continental areas and positive in oceanic areas? Extending the question further, why do the predominant negative and positive anomalies respectively correspond to the mountain peaks and ocean depths? Although the Bouguer gravity data are not brought on to an even datum, there is fairly a good inverse correlation of Bouguer anomalies with height/depth as well as seismic data. This obviously indicates the excess mass reflected as gravity lows and the deficit mass as gravity highs with respect to the geoid/ellipsoid surface. This is in contrast to the theory of the gravity field which is proportional to the excess or deficit mass. Mathematically speaking, the observed anomalies are proportional to the vertical gradient of gravity, indicating excess mass above the geoid as gravity lows and deficit mass below the geoid as gravity highs. If this were true, far reaching implications arise in the understanding of the theory and interpretation of Bouguer anomalies. ”
The anomalies are negative in continental areas and positive in oceanic areas. The anomalies are also negative in the mountains. These anomalies appear to go against the theory that the anomalies are due to the attraction of mass.
On discrepancies, one writer states:
“ On the basis of newtonian gravity, it might be expected that gravitational attraction over continents, and especially mountains, would be higher than over oceans. In reality, the gravity on top of large mountains is less than expected on the basis of their visible mass while over ocean surfaces it is unexpectedly high. To explain this, the concept of isostasy was developed: it was postulated that lowdensity rock exists 30 to 100 km beneath mountains, which buoys them up, while denser rock exists 30 to 100 km beneath the ocean bottom. However, this hypothesis is far from proven. Physicist Maurice Allais commented: ‘There is an excess of gravity over the ocean and a deficiency above the continents. The theory of isostasis provided only a pseudoexplanation of this.’15
The standard, simplistic theory of isostasy is contradicted by the fact that in regions of tectonic activity vertical movements often intensify gravity anomalies rather than acting to restore isostatic equilibrium. For example, the Greater Caucasus shows a positive gravity anomaly (usually interpreted to mean it is overloaded with excess mass), yet it is rising rather than subsiding. ”
Bouguer Anomalies - Australia
We find the following depiction of Australia's Complete Bouguer Anomalies and Free Air Anomalies on a University of California Berkeley lecture on gravimetry (Archive) p.3, showing that the unfiltered anomalies are negative over continental areas and positive over oceanic areas:

Bouguer Anomalies - Alps of Germany
https://www.leibniz-liag.de/en/research/methods/gravimetry-magnetics/bouguer-anomalies.html (Archive)
“ This map shows the Bouguer anomalies over the whole of Germany and surrounding areas, in a detailed but still clear way.
...The resulting gravity anomalies vary across the mapped area from -170 mGal in the Alps to +40 mGal around the gravity low in the Magdeburg area. ”
The above shows that the anomalies are negative in the Alps of Germany.
Inverse anomalies
It is theorized by isostasy that there are inverse anomalous structures beneath the mountain ranges, which mirrors the topography, giving the low gravity readings:
“ Negative anomalies exist beneath mountain ranges, and mirror the topography and crustal thickness as determined by seismic studies. Thus, the low density continents appear to be floating on higher density mantle. ”

Seismic Interpretation
The negative gravity readings at the mountains are conventionally attributed to Isostasy. However, if gravimeters are really seismometers which pick up low frequency seismic waves originating from within the earth then we should expect the bulk mass of a mountain to dilute a seismic wave more so than other areas, creating a negative anomaly.
Seismic Wave Propagation
Background Seismic Noise
It should be noted that there is constant background seismic noise, which emanate from the earth. From http://microglacoste.com/gPhoneNoise/gPhoneSeismicNoise.pdf (Archive) we read:
“ It is interesting to speculate on the precise origin of the background seismic noise. Haubrich et al ii for example, open their article with the following description of the seismic noise background and the large interest it has generated over the years as well as the intractability of its investigation:
The low‐level background unrest of the earth, called microseisms or earth noise, has puzzled seismologists and other scientists for nearly a century. The problem of its nature and causes has proved particularly unyielding, not, however, for lack of investigation. A bibliography covering work up to 1955 [Gutenberg and Andrews, 1956] iii lists over 600 articles on the subject; one covering the years from 1955 to 1964 [Hjortenberg, 1967] iv lists 566. Unfortunately, much of this work has advanced the subject but slightly. ”
Airborne Seismic Waves
It should also be noted that seismic waves can become airborne, which could explain the ability of gravimeter devices on airplanes to register the anomalies.
https://en.wikipedia.org/wiki/Seismic_wave (Archive)
“ Primary waves (P-waves) are compressional waves that are longitudinal in nature. P waves are pressure waves that travel faster than other waves through the earth to arrive at seismograph stations first, hence the name "Primary". These waves can travel through any type of material, including fluids, and can travel nearly 1.7 times faster than the S waves. In air, they take the form of sound waves, hence they travel at the speed of sound. Typical speeds are 330 m/s in air, 1450 m/s in water and about 5000 m/s in granite. ”
Underground Detection
Q. If the gravimeters are picking up background seismic activity, how is it that gravimeters can detect underground oil deposits and other structures?
A. If seismic vibrations are originating from deep within the earth and are passing though various substances as they reach the detector on the surface, and those signals change slightly when the detector passes over the underground body, it may be possible to subtract some elements to see others through data analysis, just as how seismographers try to use seismic waves to detect tunnels. See: Phys.org - Detecting tunnels using seismic waves not as simple as it sounds (Archive)
Noise Analysis
On analysis of the gravimeter we find its primary purpose is to measure noise and use many software algorithms to interpret and filter the noise. Every part of the device's components—the lasers which measure the motion, the mirrors, the springs which launch the mass up and down the small tube, and all component parts—are all connected in some manner to the earth, and are subject to noise and vibrations.
https://link.springer.com/chapter/10.1007/978-3-662-03482-8_9 (Archive p.1 p.2)
“ One of the most serious problems for absolute gravimeters is the vibration disturbances. ”
Marine Gravimeters
Below we see an example of gravimetry devices and methods for marine gravimetric surveying:
http://www.iitk.ac.in/nicee/wcee/article/WCEE2012_1237.pdf (Archive)
An example is given of outputs from VSE, Accelerometer, and Gradiometer devices on a mid-size ship navigating Toyama Bay, Japan:

Following the illustration we find the following:
“ FINDING GRAVITY FROM VERY NOISY DATA
In the previous section, the low-pass filter is used to find the gravity from the noisy data. We can expect that the variation of gravity consists of components with long period, however the vibration of carrier with short period. If this expectation is satisfied, the low-pass filter should work well. Actually, analysis for the first observation on an observation wheel works well, though, not for the other two observations. The reason is the difference of the amplitude of the noise: it is very difficult to pick up the gravity data with very small amplitude from very large vibration of the carrier. This must be limitation of simple filtering technique.
To reduce the vibration of the carrier, we can choose two different approaches. ”
From the above we see that a need to use algorithms and filters to 'find the gravity' from noise. The levels of g are not readily apparent, and must be constructed by subtracting from the noise to 'find gravity'. The above passage states that "We can expect to find the variations of gravity consists of components with long period, however the vibration of the carrier with short periods."
The reader may decide whether the process of subtracting vibrations with one characteristic to reveal other vibrations is truly measuring gravity. Why does "gravity" need to be found?
Galathea-3: A global marine gravity profile
The Danish vessel Galathea-3 describes its methods for gravimetric surveying:
Galathea-3: A Global Marine Gravity Profile (Archive)
“ The Galathea-3 navigation data included raw depth records provided by The Danish Hydrological Office. The data transfer was sometimes unstable and the data themselves were often very noisy. A preparation of such data for the Bouguer gravity processing requires a cumbersome data cleaning the removal of the spikes, the smoothing, and often the interpolation ”
We see that the process involves extensive data analysis, filtering, and clean-up from noise — to 'find gravity'.
Airborne Gravimetry
Airborne gravimetery methods reveal the same:
Improving the Accuracy and Resolution of SINS/DGPS Airborne Gravimetry (Archive)
“ Because the resulting signal is very noisy (see Sections 2.3.2 to 2.3.4 for details), its derivation is followed by a filtering step that removes most of the noise by low-pass filtering the data. ”
Again, we see that filtering is necessary to clean up the noise.
General/Land Based Absolute Gravimetry
Per normal land-based gravimeters, the following paper describes the process of turning a laser signal from an absolute gravimeter into a "variation of gravity":
Ultra-high Precision, Absolute, Earth Gravity Measurements (Archive)
The paper describes that the fringe signal from the laser beam in an absolute gravimeter is digitized and processed:
“ One of the new features of our setup is that the whole fringe signal (with up to 1.6 million data points) is digitized and processed. In other gravimeters usually just parts of the fringe signal are used for data processing. Since the duration of our FB’s fall in the MPG-1 is about 200 ms, the resultant signal reaches a frequency of up to 6.2 MHz. As an industry standard, a sampling rate of at least 7 times the measured frequency is suggested. ”
Processing Steps

The fringe signal from the laser must be filtered with software:

The remainder of the document describes how the filtering occurs. All sources, to the best of the author's ability, are given an "uncertainty budget," to which is subtracted from the noise. The uncertainty budgets are estimated ranges to which a phenomenon may be contributing to the noise. All possible phenomena in nature must be considered and precisely defined. Everything from air drag, electrostatic fields, pressure, seismic vibrations, &c.
In the Table of Contents we find a list of items, showing the various elements which are subtracted:
- 4.6 Uncertainty budget of the measured imbalance – Method II. . . . 84
- 4.7 Uncertainty budget: COM and OC adjusted – Method II. . . . . . 84
- 5.1 Uncertainty budget for air drag . . . . . . . . . . . . . . . . . . . 89
- 5.2 Uncertainty budget for outgassing . . . . . . . . . . . . . . . . . . 90
- 5.3 Uncertainty budget for eddy currents . . . . . . . . . . . . . . . . 91
- 5.4 Uncertainty budget for electrostatic field . . . . . . . . . . . . . . 91
- 5.5 Uncertainty budget for instrumental masses . . . . . . . . . . . . 94
- 5.6 Uncertainty budget for laser verticality . . . . . . . . . . . . . . . 96
- 5.7 Length standard specifications. . . . . . . . . . . . . . . . . . . . 96
- 5.8 Uncertainty budget for laser stability . . . . . . . . . . . . . . . . 97
- 5.9 Frequency standard specifications. . . . . . . . . . . . . . . . . . . 98
- 5.10 Uncertainty budget for clock stability . . . . . . . . . . . . . . . . 98
- 5.11 Uncertainty budget for corner cube rotation . . . . . . . . . . . . 98
- 5.12 Uncertainty budget for radiation pressure . . . . . . . . . . . . . . 99
- 5.13 Uncertainty budget for beam divergence . . . . . . . . . . . . . . 100
- 5.14 Uncertainty budget for temperature gradient . . . . . . . . . . . . 101
- 5.15 Uncertainty budget for seismic noise . . . . . . . . . . . . . . . . 107
- 5.16 Uncertainty budget for speed of light . . . . . . . . . . . . . . . . 108
- 5.17 Uncertainty budget for effective height . . . . . . . . . . . . . . . 109
- 5.18 Specifications of Photoreceiver. . . . . . . . . . . . . . . . . . . . 110
- 5.19 Uncertainty budget for amplifier . . . . . . . . . . . . . . . . . . . 111
- 5.20 Uncertainty budget for solid Earth tides . . . . . . . . . . . . . . 113
- 5.21 Uncertainty budget for ocean loading . . . . . . . . . . . . . . . . 113
- 5.22 Uncertainty budget for polar motion . . . . . . . . . . . . . . . . 114
- 5.23 Uncertainty budget for environmental pressure . . . . . . . . . . . 115
- 5.24 Uncertainty budget for Coriolis force . . . . . . . . . . . . . . . . 116
- 5.25 Uncertainty budget for MPG-1. . . . . . . . . . . . . . . . . . . . 117
- 5.26 Uncertainty budget for MPG-2. . . . . . . . . . . . . . . . . . . . 118
Once all of these items and their theoretical uncertainties are subtracted, we are left with "gravity".
Gravimeter Tides
The above pdf mentions that long-term analysis of the gravimeter noise can detect the tides:

The main conclusion from this is that the tides may be related in some manner to vibration or noise that is being processed. No mechanism is presented, or is identifiable, from a long term analysis of noise trends.
Absolute Gravimeter Fringe Noise
Still on the topic of general/land-based gravimetry, we look at the following paper discussing absolute gravimeters:
From the introduction the author states that the input is a noisy fringe signal.
“ The advantages of digitizing the entire fringe signal are as follows: the imperfect electronic components are eliminated; the full information on the quality of the fringe signal is available; a noisy fringe signal is digitally filtered at the pre-processing steps; different numerical algorithms to calculate a g value can be interchangeably applied. ”
The g value must be extracted with various methods. It is not direct and apparent:
“ Usually, the fringe signal is digitized at a sampling rate exceeding its maximum frequency. However, a few methods have demonstrated the possibility to extract a g value from the fringe signal sampled far below the Nyquist criterion (table 1). ”
Multiple methods, functions, to "extract" the gravity value from the "noisy fringe signal."
Not an obvious and apparent method; multiple models are involved:
“ This method has been developed by Niebauer et al [18]. The basic idea is to extract the gravity value directly from the undersampled waveform of the fringe signal given by the non-linear model (1). To find the initial estimates of the model parameters, required in the non-linear leasts quares adjustment, it was proposed to iteratively demodulate the digitized waveform. For this the acquired fringe signal is multiplied by a swept sinusoid, denoted as a complex heterodyne function. This method requires prior knowledge of the sweep parameters. A complex heterodyning is used to reduce the bandwidth of the demodulated signal in order to double the signal-to-noise ratio, compared with a single sideband demodulation [18]. ”
Filtering agreement can be made with other fringe signal processing methods:
“ Up to now, a few comparisons of different fringe signal processing methods have reported an agreement within several parts in 10^9 of g [10, 18] or even larger [12, 16]. ”
These processes are filtering out the noise to find trends. From the conclusion we read:
“ 5. Conclusions
For the first time, a comparison of the three different digital fringe signal processing methods, realized in the same absolute gravimeter, has been completed. The two-sample zerocrossing method, the windowed second-difference method and the method of non-linear least-squares adjustment using the initial parameter estimates, found by the demodulation of the undersampled fringe signal, have been compared in numerical simulations, hardware tests and actual measurements with the MPG-2 absolute gravimeter. Up to now, diversity of the digital fringe signal processing methods in absolute gravimetry was mainly caused by a certain technical restriction: processing of the huge amount of digitized fringe data was limited by the available computing capabilities. Owing to this, several original, though complicated, algorithms have been developed. In contrast, the reported comparison involves the simple and straightforward method to detect all the zero-crossings in a digitized fringe signal. ”
This document was written in 2010. If Gravimetry were really "simple direct measurement of the acceleration," as some have claimed, then the reader might ask, why was it limited by pre-2010 computing capabilities? The answer is that it is not direct at all. It is the many algorithms necessary to interpret the "noisy" fringe signal (even for land-based absolute gravimeters) which needs large amounts of computing power. The process is interpretation of a noisy fringe signal from what we learned earlier was a seismometer.
From the paper:
“ Therefore, a combination of the different methods of fringe signal processing in the same instrument is a useful tool to compose a more complete uncertainty budget. ”
Uncertainty budgets, just as we saw in the previous paper, are subtracted from the noise in the effort to find gravity.
Underground Target Detection
While gravimetry results have a relationship with geographical areas relating to positive anomalies at the seismic zones and negative anomalies on the continents and mountains, the use of gravimetry for reliable detection of underground targets is murkier. Gravimetry must be used alongside other techniques, as gravimetry alone provides poor understanding of the earth.
From a Los Alamos National Laboratory associated geophysics program -
https://permalink.lanl.gov/object/tr?what=info:lanl-repo/lareport/LA-UR-17-30673 (Archive)
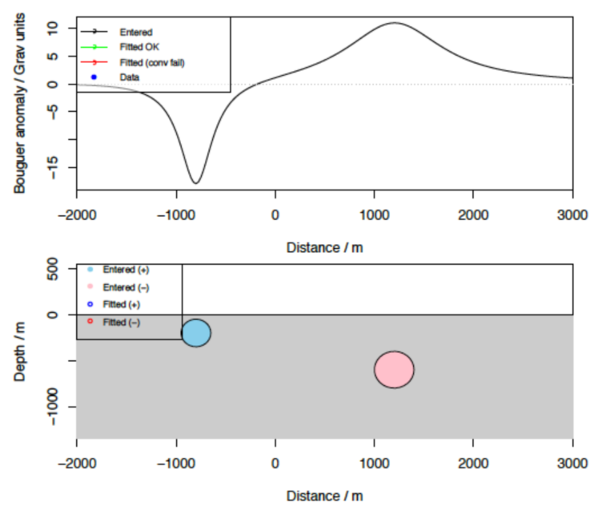
- “ Both negative and positive density contrasts can be modeled for any gravity survey target. The lower panel shows a cross-section through the ground. The circles represent denser (right) and less dense (left) regions. The upper panel shows the gravity that might be measured at the surface. ”
- “ WARNING!
- Gravity is a Potential Method, meaning that we try to interpret the sources that contribute to a total potential force (this is also true for magnetic surveying). As such, we can always find a variety of physical models that can produce the same observations. This means that no model based solely on gravity observations can be considered to be uniquely correct. Always, additional information is needed before confident interpretation of the gravitational data is possible.
- ~
- Combining gravity models with other information – geologic, seismic, electromagnetic, will improve confidence in the results. Gravity is a potential method, meaning that its results are ambiguous in isolation. Other information is always needed to interpret gravity anomalies with confidence. ”

From An Introduction to Geophysical Exploration -
http://www.science.earthjay.com/instruction/HSU/2016_spring/GEOL_460/lectures/lecture_07/geophysical_expoloration_gravity.pdf (Archive)
- “ The interpretation of potential field anomalies (gravity, magnetic and electrical) is inherently ambiguous. The ambiguity arises because any given anomaly could because by an infinite number of possible sources. For example, concentric spheres of constant mass but differing density and radius would all produce the same anomaly, since their mass acts as though located at the centre of the sphere. This ambiguity represents the inverse problem of potential field interpretation, which states that, although the anomaly of a given body may be calculated uniquely, there are an infinite number of bodies that could give rise to any specified anomaly. ”
From a Doctoral Thesis, Gravimetry for Geothermal Exploration -
https://doc.rero.ch/record/255651/files/00002456.pdf (Archive)
- Gravity anomaly interpretation
- “ Interpretation of gravity anomalies can be made in two ways, directly or by building a gravity model. Concerning the latter, the gravity anomaly generated by the model will be compared with the measured gravity. In all cases the nature of the gravity makes its interpretation ambiguous, as several different bodies can induce the same anomaly as presented in figure 2.16. Therefore gravity is often used in combination with other geophysical methods to avoid or decrease the ambiguity. ”
From a course, Physics in Proportion -
https://www.mtholyoke.edu/courses/mpeterso/phys103/PhysicsInProportionI.pdf (Archive)
- “ A gravimeter is like a crude eye, looking into the Earth, but without any ability to focus, able to report only that there is something interesting nearby or there isn’t. ”
See Also
Flat Earth Gravity Topics
- Universal Acceleration - The Universal Accelerator Main Page
- Equivalence Principle - Gravity behaves as if the Earth is accelerating upwards
- Evidence for Universal Acceleration - Experiments and background foundation showing that Earth is accelerating upwards
- Variations in Gravity - Various experiments have failed to find variations in gravity or violations of the Equivalence Principle
- Gravitational Time Dilation - Time dilates in accordance with the uniform prediction of the Equivalence Principal to various heights
Round Earth Gravity Topics
- Weight Variation by Latitude - An uncontrolled weight change experiment which is not performed in a vaccum chamber
- Cavendish Experiment - An inconsistent short range attraction experiment
- Gravimetry - Gravimeters are described to be seismometers by mainstream sources
- Isostasy - The mass attraction of mountains and continents does not behave in accordance with 'gravity'
Related